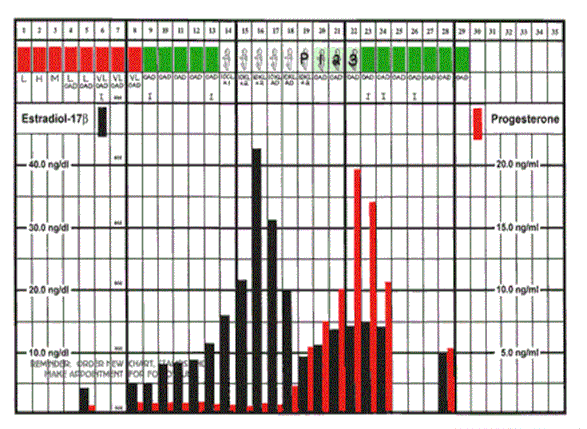
In Figure 40-2 (taken from the NaPro textbook p. 511.), a normal cycle with a normal mucus pattern, Peak Day and post-Peak phase is illustrated.
The mucus cycle score is 15.7 and post-Peak phase is 10 days .
This normal CrMS chart shows also the daily levels of E2 and progesterone. The hormonal profiles are normal.
In addition, the estrogen levels (black bars) and progesterone levels (red bars) demonstrate the correlations in the monitoring of the CREIGHTON MODEL System's biologic markers and their correlation with the hormonal events of the fertility cycle.
As ovulation approaches, the estrogen rises and mucus is observed
When the estrogen levels are low or the progesterone levels are increasing, there is no mucus flow and dry days are observed.
(From: Pope Paul VI Institute research, 2004).
The Creighton Model FertilityCare System is an incredible system for self-monitoring a woman's reproductive gynecologic health.
This figure demonstrates how valuable this system is in reproductive and gynecologic health maintenance showing different examples. In all those examples, the biomarkers (limited mucus cycles, premenstrual spotting, e, the length of the post-Peak phase) helped to identify gynecological problems and eventually have them treated with our NaProTECHNOLOGY Medical Consultants.
NaProTracking for a woman's health and fertility issues empowers women!